Profilers are essential tools for determining memory and performance bottlenecks. This guide covers the different profiling tools that ship with Unity, their uses, and important caveats.
Profilers are essential tools for determining memory and performance bottlenecks. Unity comes with integrated tools and an instrumentation profiler (tracer) that provide a quick overview of the state of a Project. This guide features the different profiling tools that ship with Unity, their uses, and important caveats. For additional tips and tricks, see the Profiler documentation.
To choose the right profiling tool for your application, it’s important to understand the difference between profiling, sampling and tracing:
Profiling — The process of collecting performance data on the target. A profiling session in most tools typically includes sampling and tracing.
Sampling — The process of periodically stopping the application under investigation during the profiling session (a profile). Sampling typically involves collecting backtraces (call stacks of active threads), which helps to understand statistically how much time each function takes. Additionally, it is possible to sample hardware counters. This process is inherently imprecise when the Profiler collects a low number of samples.
Tracing/Instrumentation — The process of collecting precise information about various activities happening in the profile or the system. For example, the Profiler may trace a call to the profile of a specific library function and record the exact duration and timestamps.
Samplers are more predominant than tracers, which often makes it difficult to obtain accurate timing information due to the lack of an advanced tracer.
The goal of this guide is to fit you with the necessary knowledge to profile and optimize applications made with Unity. This guide covers the following areas:
The Unity Profiler is an instrumentation profiler. The Profiler provides per-frame performance metrics, which helps identify bottlenecks. It also gives you an idea of what performance is like when running an application outside of the Editor. Bear in mind that the Profiler has an overhead. The most precise way to review performance is to create a build for the target platform and profile it on the target device. While the best performance observable would be running in a non-development build, the Unity Profiler only allows for use with development builds.
To enable profiling for an app, go to Build Settings (menu: File > Build Settings), and select DevelopmentBuild and Autoconnect Profiler. When launching the application, the Profiler automatically connects. Or, attach it to the application in the Profiler Controls via the Editor drop-down menu.
The Profiler helps you understand how much time the application spends rendering each frame, and splits this into CPU, rendering, memory, audio, physics, UI, and network. To learn more about the Profiler, see Introduction to the Profiler video and the documentation.
Note: Don’t compare the Unity Profiler results across Unity versions. The overhead of the Unity Profiler itself is not insignificant, and changes to the internal Profiler architecture across releases might significantly affect the results.
Underreporting
On rare occasions, the Profiler does not display Unity internal systems with sufficient profile labels.
Select image to expand
Type caption for image (optional)
Should you encounter such a missing label (or require more detailed information about a given subsystem), please file a bug report and let us know about the missing marker.
Editor profiling
There are significant caveats to consider when profiling a Project in the Editor. Sometimes lag and jitter may occur as the host renders the same content multiple times, depending on how many views are open. Rendering the Editor itself also has some overhead. It is vital to profile performance regularly on the target device and not rely solely on data obtained when profiling in the Editor.
Deep profiling
Use Unity’s Deep Profile mode to locate the specific causes of managed allocations. In Deep Profile mode, all method calls are recorded individually, providing a clearer view of where managed allocations occur within the method call tree.
Note: Since Unity 2017.3, Deep Profile mode works not only in the Editor but also on Android and Desktop using the Mono scripting backend.
Note: Since Unity 2019.3, Allocation Call Stacks reporting is available for all Players and Deep Profiling support can be enabled at build time for all Platforms, including IL2CPP
To enable Deep Profile mode on Desktop, use the -deepprofiling command line argument.
To enable Deep Profile mode on Android, use the adb command line argument. For example:
~$ adb shell am start -n com.company.game/com.unity3d.player.UnityPlayerActivity -e 'unity' '-deepprofiling'
The Deep Profiler button remains grayed out during profiling.
Profiling Memory in Editor
Profiling memory in the Editor is useful for understanding the general trends behind memory behavior, but not for comparing actual values on a specific target device.
Every Mesh has the read/write flag turned on during a run in the Editor, irrespective of the Read/Write Enabled setting in the Asset Import Settings. This alone doubles the Mesh memory reflected in the Profiler.
Running the application in the Editor produces more temporary memory allocations. For example, GetComponent uses temporary GC allocations in the Editor when the Component is null. That way, Unity can throw an exception in the Editor which does not occur at run time on the target platform.
Rendering Statistics
Unity provides the option to display real-time rendering statistics in the Game view, such as FPS, draw calls, VRAM usage, triangles and vertex counts. To display a Statistics overlay with real-time rendering information, go to the Game view and click the Stats button in the toolbar above the viewport. These statistics help you analyze and improve batching and GPU cost by indicating how many draw calls Unity issues and how many draw calls you save with batching.
Select image to expand
Type caption for image (optional)
The Statistics window is only available in the Game view.
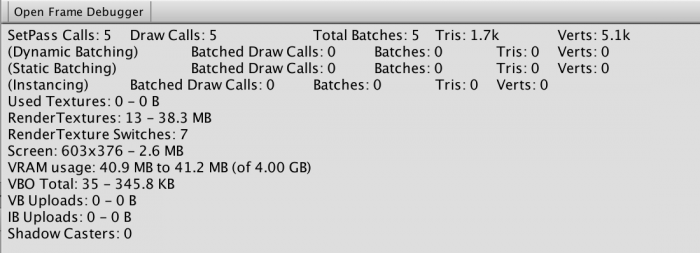
For more detailed rendering statistics, open the rendering tab of the Profiler.
Select image to expand
Type caption for image (optional)
The rendering tab shows more details per frame.
In the above example, the empty Scene has 5 SetPass calls and issues 5 draw calls.
SetPass call count is crucial because it negatively impacts performance the higher it is. SetPass calls perform pipeline state changes under the hood. SetPass call count should be as low as possible.
Draw calls per-se are not necessarily problematic as long as the application is not CPU bound. This is because draw calls are executed on the render thread which runs on the CPU. Reduce the probability of being CPU bound by using multithreaded rendering.
Issuing Draw Calls
For better performance, issue more draw calls with the same pipeline state than fewer draw calls with more changed states. Having many draw calls without a state change lets Unity write the draw commands to the command buffer directly, which is the fastest driver path. The fastest driver path enables Unity to put the indices for all collected draw calls into one buffer. Otherwise, Unity needs to split the data up into several buffers due to the state changes, which results in more store and load calls on the graphics memory due to multiple buffers.
Multithreaded Rendering & Graphics Jobs
Multithreaded rendering and graphics jobs often help to improve performance, but when debugging or profiling they can hinder you from seeing all relevant numbers. To identify issues easier, disable the setting when profiling graphics-specific. For detailed information, see the Optimizing Graphics in Unity guide.
Unity Frame Debugger
The Frame Debugger allows you to freeze playback on a single frame and step through individual events. This enables you to see how Unity constructs a Scene and identify optimization opportunities. It also shows GameObjects that render unnecessarily, and you can disable those GameObjects to reduce draw calls per-frame.
Note: The Frame Debugger does not show individual draw calls or state changes. Instead, it shows how Unity constructs a frame. The Frame Debugger also does not provide enough information about the draw call itself, such as matrices or vertex screen coordinates -- especially so on legacy Shaders (for example, Unlit/Texture). Only native GPU profilers show detailed draw call information, usually with timing information attached. The Frame Debugger can be very helpful in debugging pipeline problems or issues with batching, primarily when working with Unity UI. For more information, read the Unity Frame Debugger documentation.
Overdraw View
Unity provides a specific render mode for viewing overdraw in a Scene. Please read more about overdraw and the overdraw view in the Optimizing Graphics in Unity guide.
Memory Profiler
This section describes a demo Project that demonstrates the use of the profiler API. The latest information for the memory profiler can be found here, with more information available in the Memory profiling documentation.
Select image to expand
Type caption for image (optional)
A snapshot of the Memory Profiler available on Bitbucket.
The tool tracks memory allocated by Unity's subsystems, and from user scripts only when using the IL2CPP back-end before Unity 2017.3. The Memory Profiler cannot track allocations from third-party tools using a custom allocator. As of 2017.3, the tool also supports tracking managed objects under the Mono scripting runtime.
Additionally, to profiling your application with the built-in Unity Profiler, it’s essential to also profile with platform-specific tools. For information on how to use those tools, please refer to the documentation from the vendor. The following table includes profiling tools for different platforms.
Android supports a vast variety of devices, which comes with some constraints, such as specific tools for specific chipsets. Many platform-specific tools yield useful information about both the target device and app performance.
There are profiling tools available which help to profile the Java Managed Environment, such as the Memory Monitor in Android Studio. The Memory Monitor shows how an app allocates managed memory over the course of a single session. This tool, however, only provides data for the Java Environment and does not offer sufficient data on the native systems, which are essential for most applications made with Unity. Only a small portion of Unity’s code runs in a Java managed environment, with the majority being driven by systems in the native environment.
Android native profiling tools depend on the target chipset, and each chipset manufacturer has their own suite of tools to gain data from CPU, GPU, and memory. There are tools that provide chipset spanning performance analysis as well, such as Android Studio.
The following table includes a collection of tools available to profile Android devices.
Tool
Target Devices
GPU
CPU
System
Description
OS
API
Systrace
Any chipset
Yes
Command Line only.
Linux Windows
Vulcan
For other platforms, similar tools are available. It’s good practice to verify and compare results on different platforms, especially when they share similar hardware or the same graphics APIs. Systems often act similarly, even across different platforms. Profiling on non-target platforms is not ideal, but it is better than not profiling at all.
Each tool helps to identify bottlenecks and takes appropriate actions towards solving the causes. The following section shares tips on profiling Unity applications using specific tools.
Snapdragon Profiler
This profiler is for devices using Snapdragon chipsets and it can show a significant amount of performance data. All the data can be overwhelming at first, but you can filter data by bundle id.
There is an excellent talk from Unite 2015 called Uncover Your Game's Power and Performance Profile that covers the basics of Snapdragon Profiling and which filters are a great choice for profiling.
If the Snapdragon Profiler cannot find a device, go to the Snapdragon Settings and check whether the auto locator has set the adb path to the correct adb location. When a device is visible via the <b>adb devices</b> command, it should be visible for Snapdragon as well.
Between profiling sessions, it is useful to shutdown and restart the Snapdragon profiler. Before you unplug a device, quit the Snapdragon Profiler so that the profiler can clean up memory and network connections, and then reconnect to the device the next time without issues.
Simpleperf
Simpleperf is a sampling profiler and provides multiple CPU counters. Currently, it only exists as a command line tool.
Modern CPUs have a hardware component called the performance monitoring unit (PMU). The PMU has several hardware counters that count events like CPU cycles, executed instructions, and the number of cache misses.
Simpleperf uses perf_event_open system calls on Android to get the data from hardware perf events and uses its Linux kernel to wrap hardware counters into these hardware perf events. The Linux kernel also provides hardware-independent software events and tracepoint events, and exposes all these events to user space via the perf_event_open system call.
The best way to get the sampling profiler working with call-graphs is by using dwarf debug info instead of frame-pointer. For more information, see in the Simpleperf readme file.
You can run Simpleperf from any host development platform that the NDK supports. You can get the Simpleperf tool from the Android NDK r13b and higher (under the ndk-location/simpleperf/ directory).
Note: You cannot use the run-as command on some Samsung devices. If you do, you will receive a <b>Could not set capabilities: Operation not permitted</b> error.
###<a name="Example of obtaining sample data"></a> Example of obtaining sample data
Install Simpleperf from the NDK location onto the device into a temp data folder:
Google has blocked access to the Perf tool by default since Android Nougat, so you need to change this flag to be able to access the tool:
~$ adb shell setprop security.perf_harden 0
Now the device is ready to record data. In the following example, we:
Record on the process (-p) with an event (-e) for 20 seconds (--duration). You don’t need to add cpu-cycles explicitly because it is also the default event.
Record a dwarf-based call graph (-g) and use the --symfs argument to redirect the path.
Set the frequency to dump records (-f) with approximately 2000 records every second when the monitored thread runs.
Return the pid of the given bundle-id using `adb shell pidof com.unity.androidtest`.
Android Studio 3.1 integrates Simpleperf into its Performance Profiler and offers a simple UI for capturing data, so you do not have to use the command line. For details, see the Android CPU Profiler documentation.
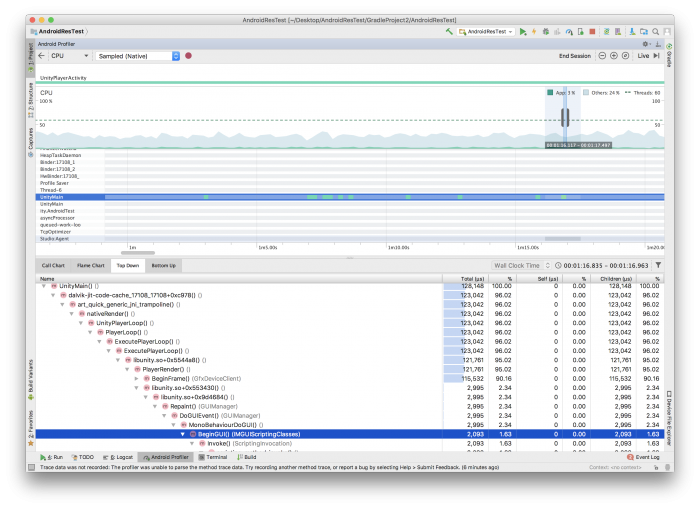
The Android Studio CPU Profiler works in a similar way to Native Debugging and works out of the box for many phones, such as the Samsung S8. To get native traces, follow the following steps:
Export your Unity Project as Gradle project and open it in Android Studio. For more information, see Gradle for Android.
Start profiling.
Select the Sampled (Native) profile in the CPU Profiler.
Select the thread you want to profile, for instance, UnityMain.
Press the record button and stop recording when done.
When the Profiler stops recording, inspect the sampled data after. Note: For very long sessions, you should increase Android Studios’ memory limit.
The Call Chart is similar to the data in the Unity Timeline Profiler.
Select image to expand
Type caption for image (optional)
The Top Down view shows the native stack trace to identify bottlenecks. For more information on interpreting traces, see the dissecting native stack traces section.
Select image to expand
Type caption for image (optional)
The Profiler also offers a memory tab which provide data on the memory consumption. If this is relevant for you, read more about it in our guide on Memory Management in Unity.
Note: It is not possible to symbolicate user code and display function names when compiled with IL2CPP, although you can set the path of the symbols in the Android Studio Project Settings (Menu: Run > Edit Configurations > Debugger).
You can use the NDK utility ndk-stack to symbolicate the call stack of an adb logcat output. You can find the tool in the root directory of your NDK installation. You need to ensure that your symbol files are called libunity.so instead of libunity.dbg.so, otherwise the ndk-stack tool will fail to locate them; simply rename the files if needed. You can call the tool using the following command in the terminal:
Alternatively to the ndk-stack tool, there is a tool available on Bitbucket that allows you to symbolicate the release crash dumps available on the Developer Console from the Play Store.
It does not provide the full line numbers from the call stack, but it allows you to see the method names and give you a much better idea of what could be going wrong. Full instructions on using the tool are in the tool’s readme file on Bitbucket.
Intel Graphics Frame Analyzer is a powerful, single-frame analysis and optimization tool with detailed metrics down to the draw call level, including shaders, render states, pixel history, and textures. The Graphics Frame Analyzer can be used to experiment with performance and visual impacts without having to recompile actual code on Windows. You can use it to:
Select a draw call and verify its contribution to the frame, alpha channel, color, format, and depth buffers.
Quantify performance optimization opportunities with render experiments per draw call.
Solve issues with shadowing, lighting, or color schemes by locating misplaced objects.
First, you use the System Analyzer to determine whether the application is GPU bound. If that’s the case, the Graphics Frame Analyzer helps to perform tests to find out how to reduce overhead.
Experiments
To identify bottlenecks, there are four different tests (performed from within the Experiments tab):
Disable Erg(s)
2x2 Textures
1x1 Scissor Rect
Simple Pixel Shader
Disable Erg(s)
Use this option to keep the selected ergs from being rendered and to test Scene efficiency, for example, by disabling all affected erg(s) of a post-effect, or a specific model. This would be similar to disabling the renderer on a GameObject.
2x2 Textures
Use the 2x2 Textures override mode to help identify potential performance bottlenecks with textures bandwidth. The Graphics Frame Analyzer replaces all textures for a Scene with simple 2x2 pixel textures. Usually, the Graphics Frame Analyzer uses a simple halftone or a colorized bitmap for this option.
If using this override mode significantly improves the frame rate, the GPU is bound to texture bandwidth while loading textures from the CPU instead of using a cached version of that texture from the GPU. If the total size of textures is high for a Scene, consider reducing one of the textures so that all the texture maps fit into the GPU's texture cache for that Scene.
1x1 Scissor Rect
The 1x1 Scissor Rect override mode is a DirectX API override. However, the implementation of this override mode is highly dependent upon a specific graphics configuration. In particular, scissoring may occur either before or after the pixel shader stage. Using the 1x1 scissor rect nullifies the workload of units after the vertex shader by clipping all rasterization and shading work.
Simple Pixel Shader
The Simple Pixel Shader experiment replaces the pixel shaders in your frame with a simple pixel shader, which writes a constant color to the render target for every selected erg. If the frame rate significantly decreases as a result of this experiment, you may need to further analyze shaders to see whether you can reduce rendering time without detracting from the visual quality of the Scene.
One thing to keep in mind is that enabling this experiment for ergs that do not reference a pixel shader in the original Scene may result in a slower rendering time when using this override mode. This may seem counterintuitive, but ergs are now forced to use a pixel shader, and this pixel shader may be slower than the fixed-function shader.
Intel GPA is a powerful tool and has many use cases. For more detailed information, please also see the official Intel documentation.
Profiling Applications Made with Unity
Profiling Applications Made with Unity
General Tutorial Discussion
0
0
1. Profiling
0
0
2. Unity Profiler
0
0
3. Third-Party Profiler
0
1
4. Android Profiling Tools
0
0
5. Intel Tools
0
0
Sorry, this learning content is no longer available.
This content has been removed, but don’t worry – you can still continue your learning journey with the content below, which covers many of the same topics and skills:
Sorry, this learning content is no longer available.
This content has been removed, but don’t worry – you can still continue your learning journey with the content below, which covers many of the same topics and skills: