Rendering graphics in Unity is a complex task. This guide provides a better understanding of the underlying concepts related to rendering, and best practices for reducing the rendering workload on the GPU.
Rendering graphics in Unity is a complex task. For a basic understanding of how it works, see the Unity documentation on the Rendering Pipeline documentation before reading this guide. This guide provides a better understanding of the underlying concepts related to rendering, and best practices for reducing the rendering workload on the GPU.
Lighting Scenes
Camera
Textures
Multithreaded Rendering & Graphics Jobs
Frame Buffer
Shaders
To effectively optimize your graphics rendering, you need to understand the limitations of your target hardware, and how to profile the GPU. Profiling helps you check and verify that the optimizations you’re making are effective.
GPU benchmarks
When profiling, it’s useful to start with a benchmark. A benchmark tells you what profiling results you should expect from specific GPUs when your lighting is running optimally.
See the GFXBench website for a great list of different industry-standard benchmarks for GPUs and graphics cards. The website provides a good overview of the current GPUs on the market, and how they compare against each other.
The Camera is a core component, and every Unity application heavily relies upon it. This means that there are many options that, if not managed appropriately, can lead to poor performance, such as clear, culling and skybox options.
Clear
On mobile tile-based renderers, the clear command is particularly important. Unity takes care of the details, so you only have to set the clear flags on the Camera and avoid using the "Don’t Clear" flag when targeting mobile devices. The underlying behavior of the clear command depends on the platform and graphics driver, but depending on the clear flag you choose, it can impact performance significantly, because Unity has to either clear the previous content, set flags to ignore the previous content, or read previous content back from the buffer. Do NOT, however, perform unnecessary clears on streaming GPUs -- that is, the sort usually found in desktops and consoles.
Clear flags
On mobile, avoid Unity’s default Skybox (appropriately named Default-Skybox), which is computationally expensive and which is enabled by default in all new Scenes. To disable Skybox rendering completely, set the Camera.clearFlags to SolidColor. Then go to the Lighting Settings (menu: Window > Lighting > Settings) window, remove the Skybox Material, and set the Ambient Source to Color.
Discard and Restore buffer
When using OpenGLES on Adreno GPUs, Unity only discards the framebuffer to avoid a framebuffer restore. On PVR and Mali GPUs, Unity clears to prevent a framebuffer restore.
Moving things in or out of graphics memory is resource-intensive on mobile devices, because the devices use a shared memory architecture, meaning CPU and GPU share the same physical memory. On tile-based GPUs like Adreno, PowerVR or the Apple A-series, loading or storing data in the logical buffer uses significant system time and battery power. Transferring content from shared memory to the portion of the framebuffer for each tile (or from the framebuffer to shared memory) is the main source of resource-heavy activity.
Tile-based Rendering
Tile-based rendering divides the viewport into smaller tiles with a typical size of 32x32px, and keeps these tiles in faster memory closer to the GPU. The copy operations between this smaller memory and the real framebuffer can take some time, because memory operations are a lot slower than arithmetic operations.
These slow memory operations are the main reason you should avoid loading the previous framebuffer with a glClear (OpenGLES) call on tile-based GPUs each new frame. By issuing a glClear command, you are telling the hardware that you do not need previous buffer content, so it does not need to copy the color buffer, depth buffer, and stencil buffer from the framebuffer to the smaller tile memory.
Note: Viewports with less than 16 pixels can be very slow on certain chipsets due to the way chips fetch information; setting the viewport to 2x2 pixels, for instance, can actually be slower than setting it to 16x16 pixels. This slowdown is device-specific and not something over which Unity has control, so it’s vital that you profile it.
RenderTexture Switching
The graphics driver executes load and store operations on the framebuffer when you switch rendering targets. For example, if you render to a view’s color buffer and Texture in two continuous frames, the system repeatedly transfers (loads and stores) the Texture’s content between shared memory and the GPU.
Framebuffer Compression
The clear command also has an effect on the compression of the frame buffer, including the color, depth, and stencil buffers. Clearing the entire buffer allows it to compress more tightly, reducing the amount of data the driver has to transfer between the GPU and memory, therefore allowing for higher frame rates due to improved throughput. On tile-based architecture, clearing tiles is a small task that involves setting a few bits in each tile. When complete, this makes the tile very cheap to fetch from memory. Note: These optimizations apply to tile-based deferred rendering GPUs and streaming GPUs.
Culling
Culling happens per-camera and can have a severe impact on performance, especially when multiple cameras are enabled concurrently. The two types of culling are frustum and occlusion culling:
Frustum Culling is performed automatically on every Unity Camera
Frustum Culling makes sure that GameObjects outside of the Camera frustum are not rendered to save rendering performance.
Select image to expand
Type caption for image (optional)
An example of Frustum Culling.
Note: Frustum culling is jobified in 2017.1 and later, and Unity now also culls by layer first. Culling by layer means that Unity only culls the GameObjects on layers the Camera uses, and ignores GameObjects on other layers. Afterwards, Unity uses jobs on threads to cull GameObjects based on the camera frustum.
Occlusion Culling
When you enable Occlusion Culling, Unity does not render GameObjects if the Camera cannot see them. For example, rendering another room is unnecessary if a door is closed and the Camera cannot see the room.
Select image to expand
Type caption for image (optional)
An example of Occlusion Culling.
If you enable Occlusion Culling it can significantly increase performance, but it occupies more disk space and RAM because the Unity Umbra integration bakes the occlusion data during the build and Unity needs to load it from disk to RAM while loading a Scene.
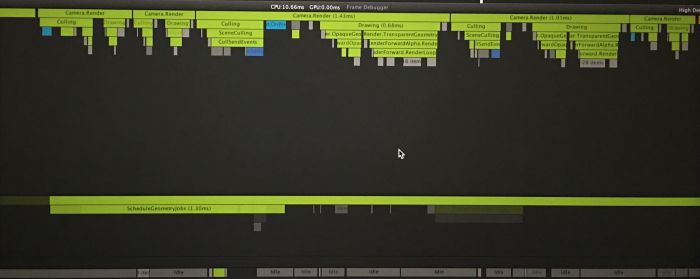
Multiple Cameras
When you use many active cameras in your Scene, there is a significant fixed culling and render overhead per-camera. Unity reduced the culling overhead in Unity 2017.1 due to layer culling, but if Cameras do not use a different layer to structure the content to render, this does not have any effect.
Select image to expand
Type caption for image (optional)
The Unity CPU Profiler shows the main thread in the timeline view. It indicates that there a multiple Cameras and you can see that Unity performs culling for each Camera.
Per-Layer culling distances
You can set per-layer culling distances manually on the Camera via Scripts. Setting the cull distance is useful for culling small GameObjects that do not contribute to the Scene when the Camera views them from a given distance.
Skinned Motion Vectors
You can enable Skinned Motion Vectors on the Camera. If you do not activate them, Unity does not use Motion Vectors, and there is no performance implication. See the scripting docs for Camera.depthTextureMode for more information. Post-processing effects such as Temporal Anti-aliasing (TAA) require and activate Motion Vectors.
Fillrate
Decreased pixel fillrate is a result of overdraw and fragment shader complexity. Unity often implements shaders as multiple passes (draw diffuse, draw specular, and so forth). Using multiple passes leads to overdraw, where the different Shaders touch (read/write) the same pixels multiple times. For further information, read the Fill Rate section in the Optimizing graphics rendering in Unity games tutorial.
Overdraw
Unity's Frame Debugger is very useful for getting a sense of how Unity draws your Scene. Watch out for situations where you cover large sections of the screen with GameObjects, as Unity continues to draw everything behind the GameObject even though it is hidden. A common example of such a scenario is calling menu screens over an active 3D screen (such as settings or the player’s inventory), but leaving the 3D Scene active behind it. You should also beware of GameObjects that Unity draws multiple times; this happens, for example, when multiple lights touch a single GameObject, because Unity then draws it for each pass (see documentation on Forward Rendering Path).
As mentioned above, UI is often the cause of overdraw and fillrate issues. Avoid these by following the tips in the Optimizing Unity UI guide.
Overdraw view
The Overdraw view allows you to see the objects that Unity draws on top of one another. You can view overdraw in the Scene View by using the Scene View Control Bar.
Select image to expand
Type caption for image (optional)
Overdraw in the Scene View Control Bar.
Select image to expand
Type caption for image (optional)
A Scene in standard Shaded view.
Select image to expand
Type caption for image (optional)
The same Scene in Overdraw view.
The overdraw view works best when you adjust the Scene View to your target resolution. Unity renders objects as transparent silhouettes. As the transparencies accumulate, it becomes easier to spot places where GameObjects draw over one another. White is the least optimal, because a pixel is overdrawn multiple times, while black means no overdraw is occurring.
Transparency
Transparency also adds to overdraw. In the optimal case, every pixel on the screen is touched only once per frame.
Alpha Blending
You should avoid overlapping alpha-blended geometry (such as dense particle effects and full-screen post-processing effects) to keep fillrate low.
Draw Order
Objects in the Unity opaque queue are rendered in front-to-back order using a bounding box (AABB center coordinates) and depth testing to minimize overdraw. However, Unity renders objects in the transparent queue in a back-to-front order, and does not perform depth testing, making objects in the transparent queue subject to overdraw. Unity also sorts Transparent GameObjects based on the center position of their bounding boxes.
Z-testing
Z-testing is faster than drawing a pixel. Unity performs culling and opaque sorting via bounding box. Therefore, Unity may draw large background objects first, such as the Skybox or a ground plane, because the bounding box is large and fills a large number of pixels that end up not being visible later after being overdrawn with other objects. If you see this happen, move those objects to the end of the queue manually. See Material.renderQueue in the Scripting API Reference for more information.
Draw Call Batching
PC hardware can push a lot of draw calls, but the overhead of each call is still high enough to warrant trying to reduce them. On mobile devices, however, draw call optimization is vital, and you can achieve it with draw call batching.
You can maximize batching by following these simple rules:
Use as few Textures in a Scene as possible. Fewer Textures require fewer unique Materials, making them easier to batch. Additionally, use Texture atlases wherever possible.
Mark all Meshes that never move as Static in the Inspector. Unity combines all Meshes marked as Static into one large Mesh at build time. You can also generate static batches yourself at runtime (for example, after generating a procedural level of static parts) using StaticBatchingUtility.
Always bake lightmaps at the largest atlas size possible. Fewer lightmaps require fewer Material state changes. For instance, a Samsung S6/S8 can push 4096k lightmaps without too much trouble, but keep an eye on the memory footprint. Note: You don’t need to include every last GameObject in the lightmap (which happens when setting GameObjects to lightmap-static). While the above advice is generally true - you should mark all non-moving GameObjects as Static - you should omit small objects (gravel, cups, books), because adding them forces Unity to create another lightmap if there is not enough space. Small objects can look great when you light them with Light Probes.
Be careful not to accidentally instance Materials. Accessing Renderer.material automatically creates an instance and opts that object out of batching. Use Renderer.sharedMaterial instead whenever possible.
Watch out for multi-pass shaders. Add noforwardadd to your shaders whenever you can to prevent Unity from applying more than one directional as multiple directionals break batching (see documentation on Writing Surface Shaders for more details).
Keep an eye on the number of static and dynamic batch counts versus the total draw call count by using the Profiler, internal profiler log, or the stats gizmo during optimizations.
For additional information and tips, read the section about draw call batching in the Unity documentation.
Instancing
Instancing forces Unity to use constant buffers, which work well on desktop GPUs but are slow on mobile devices. Instancing only starts to become useful at around 50-100 Meshes, depending on the underlying hardware.
Geometry
It is essential to keep the geometric complexity of GameObjects in your Scenes to a minimum, otherwise Unity has to push a lot of vertex data to the graphics card. 200k static triangles is a conservative target for low-end mobile. However, this also depends on whether your GameObjects are animated or static.
Platform
Static Geometry [million triangles]
Animated Skinned Meshes [million triangles]
Low-end mobile
0.2
0.05
High-end mobile
1-5
0.5-1
In Unity, you get better render performance by having few GameObjects with high polycounts, rather than many GameObjects with low poly counts.
Remove faces from geometry that you cannot see, and don’t render things the player never sees. For example, if you never see the back of a cupboard resting against a wall, the cupboard model should not have any faces on its posterior side.
Simplify Meshes as much as possible. Depending on the target platform (especially on mobile), look into adding details via high-resolution Textures to compensate for low poly geometry, potentially parallax mapping and tessellation. Be mindful and remember to profile regularly, as this can impact performance, and may not be suitable or available on the target platform.
Reduce pixel complexity (per-pixel calculations) by baking as much detail into the Textures as possible. For example, bake specular highlights into the Texture to avoid having to compute the highlight in the fragment shader.
Level of Detail (LOD)
Level Of Detail (LOD) rendering allows you to reduce the number of triangles rendered for an object as its distance from camera increases. As long as objects aren’t all close to the camera at the same time, LOD reduces the load on the hardware and improves rendering performance by adding a LOD component. It also provides lower-detail Meshes for distance groups further from the camera. There are 8 LOD levels in total. Tools like Simplygon can automate much of the Asset preparation process for LOD.
Select image to expand
Type caption for image (optional)
Select image to expand
Type caption for image (optional)
Static Scenes
When you use a static camera setup where the user cannot move (such as in some VR experiences) it is better to use a Mesh which you model with the correct details for the distance in mind, rather than storing multiple LODs per object. You can apply a similar concept for Textures by using a proper resolution for a Texture instead of mipmapping the right resolution at runtime. Applying the right details saves a lot of disk space and some run-time memory.
High-Quality LODs
If you can afford memory, you can use Mesh combination and then LOD the result. For example, a bookcase consists of unique pieces up close, but you merge them into a single Mesh and LOD them in the distance. It takes time and effort to maintain and generate high-quality LODs, even if you already have the optimal geometry, Materials, and Shaders.
Runtime Mesh Combination
If creating high-quality LODs is not possible, you can still get good results with the run-time Mesh combination (baking), which you can run when the Scene changes or during loading. However, the framerate might be lower while you run the combination, so it’s usually not recommended for mobile.
Animation LODs
When you want LODs for animations, you must manually set them up via masking.
Here’s an example: you have a human character model which does not animate fingers in lower LODs and needs no rig.
Put only the fingers in one mask without the rest of the hand or body
Create another mask without the fingers and add the rest of the body (including the hand)
Setup two layers in the Animator. The base layer uses the lower LOD (animations without the fingers). Next, create a new layer, and in its settings, enable the Sync checkbox and choose the Base Layer as the source layer. This second layer contains only the mask with fingers.
Select image to expand
Type caption for image (optional)
This setup doesn’t read all the animation’s curves, but it makes sure Unity only loads the masks which are needed. Using the sync layer makes it possible to use LODs although you need to set them up manually. Using LODs in Animation layers also saves CPU time, because animations do not evaluate with zero weights on the animation clip.
Textures are an essential part of Unity Projects, and you need to be aware of Texture size and compression. On mobile and console, it is even more crucial to keep sizes low, due to the limited run-time memory and disk space. Choosing the correct compression is essential for getting Textures down to a good size to save memory bandwidth.
Asset Auditing
By automating the Asset audit process, you can avoid accidentally or unknowingly changing Asset settings. The AssetAuditor package on Github covers many aspects of the audit process. Not only does Asset Auditing help recover performance for Textures, but you can apply it to a multitude of Asset types in Unity as well. Read more about Asset Auditing in the Understanding Optimisation in Unity best practice guide.
Texture Compression
Texture compression offers significant performance benefits when you apply it correctly. On newer mobile devices, you should favor ASTC compressed Texture formats. If ASTC is not available on your target devices, use ETC2 on Android and PVRTC on iOS.
ASTC
Unity 4.3 onwards provides support for ASTC compression added by ARM. This is significantly beneficial at build time, because it allows Unity to compress ASTC faster than ETC2 or PVRTC. On iOS, ASTC is available on A8 chips and later; on Android, ASTC is available on most modern chipsets.
Mali GPUs (Mali T-760 MP8 and up) require ASTC compression over ETC2.
If the hardware does not support ASTC (for example, on Adreno GPUs) you must choose a fallback, such as ETC2. For additional information about ASTC, see the NVidia article Using ASTC Texture compression for Game Assets.
PVRTC
PVRTC was the main Texture compression format on iOS until Apple added ASTC. If you use PVRTC on Android, you should replace it with ETC2 if possible.
Note: The PVRTC Texture format on iOS and ETC format (Android 4.x devices) requires square Textures. When compressing a non-square Texture, two behaviors can occur:
If no Sprite uses the Texture and the compressed memory footprint is smaller than it would be if left uncompressed, Unity resizes the Texture based on the non-power-of-two (NPOT) Texture scale factor.
Otherwise, Unity does not resize the Texture, and marks it as uncompressed.
GPU Upload
Unity uploads a Texture directly to the GPU after it finishes loading, and does not wait until the Texture becomes visible in the Camera frustum.
When a loading thread finishes loading Scenes or Assets, Unity needs to awaken them. Where and how loading happens depends on Unity version and the calls used to initialize the load.
Load Behavior
If you load an Asset from AssetBundles, Resources, or Scenes, Unity goes from the preloading thread (disk I/O) to the graphics thread (GPU upload). If you use Unity 5.5 or later, and you enable Graphics Jobs, Unity goes from the preloading jobs directly to the GPU.
Awake Behavior
Unity awakes Assets on the main thread directly after awakening all Scene GameObjects. If you use AssetBundle.LoadAsset, Resources.Load or SceneManager.LoadScene to load Assets and Scenes, Unity blocks the main thread and wakes up all Assets. If you’re using the non-blocking versions of those calls (for example, AssetBundle.LoadAssetAsync), Unity uses time-slicing to wake the Assets up.
Memory Behavior
While loading several Textures at once, if either the upload rate is not fast enough or the main thread stalls, you can adjust Texture buffers. Changing the default values, though, can lead to high memory pressure. You can read more about memory restrictions in Texture buffers when using time-slice awake in the RingBuffer section of the Memory Management in Unity guide.
Note: If GPU memory overloads, the GPU unloads the least-recently-used Texture and forces the CPU to re-upload it the next time it enters the camera frustum.
Unity supports several modes of rendering depending on platform availability and graphics API:
Singlethreaded Rendering
Multithreaded Rendering
Jobified Rendering
Graphics Jobs
If you do not select one of these modes in the Player Settings, Unity uses singlethreaded rendering.
Singlethreaded Rendering (single client, no worker thread)
Unity uses singlethreaded rendering by default if none of the other modes are enabled.
This causes the single client to occupy the main thread while executing the high-level rendering commands.
The single client executes all the rendering commands (RCMD) on the main thread. The client also owns the real graphics device GfxDevice and performs the actual rendering through the underlying graphics API (GCMD) on the main thread. This is suboptimal, because all commands you execute on the main thread subtract from important frametime which you could use for other subsystems running on the main thread.
Select image to expand
Type caption for image (optional)
Multithreaded Rendering (single client, single worker thread)
Unity enables Multithreaded Rendering by default if the graphics API permits it. To disable Multithreaded Rendering (generally for profiling purposes), go to the Player Settings (menu: Edit > Project Settings > Player) window, scroll down and uncheck the Multithreaded Rendering checkbox.
Multithreaded rendering in Unity is implemented as a single client, single workerthread. This works by taking advantage of the abstract GfxDevice interface in Unity. The different graphics API implementations, (such as Vulkan, Metal, and GLES) inherit from the GfxDevice.
Renderthread
When you enable multithreaded rendering you can spot the GfxDeviceClient class functions in call-stacks on a native platform profiler such as XCode. In the Unity Timeline Profiler, it is called the Renderthread.
Select image to expand
Type caption for image (optional)
The high-level rendering code of the client, which executes on the main thread, uses the renderthread.
The single client forwards all the rendering commands (RCMD) to the renderthread - a special worker thread only for rendering - which owns the real graphics device GfxDevice and performs the actual rendering through the underlying graphics API (GCMD).
Select image to expand
Type caption for image (optional)
Availability
Unity enables or disables Multithreaded Rendering conditionally, depending on the graphics API and target platform. The following table provides an overview of what platforms and Graphics API you can enable or disable Multithreaded Rendering.
Select image to expand
Type caption for image (optional)
Performance Considerations
You should enable Multithreaded Rendering whenever possible, as it usually benefits performance greatly. Tip: You should also profile the use of Multithreaded Rendering, and be aware that on very low-end devices there might be little to no benefit.
Profiling Multithreaded Rendering
Often, you need to profile Multithreaded Rendering to improve rendering performance, and it’s necessary to disable the Multithreaded Rendering setting to get correct results (see the later section on Profiling Rendering). You can also use the script-only player setting PlayerSettings.MTRendering to change Multithreaded Rendering. Alternatively, disable this in the Player Settings of the relevant platforms (see the earlier section on Availability). To disable Multithreaded Rendering in the Editor, use the following command line option: -force-gfx-direct. If you need the client device enabled (for example, to use display lists) use -force-gfx-st instead.
Jobified Rendering (multiple clients, single worker thread)
This render mode was available in Unity 5.4, 5.5 and 5.6, but has since been replaced by Graphics Jobs.
Multiple jobs, each of them running on its own thread, generate intermediate graphics commands (IGCMD). Afterwards, similar to Multithreaded Rendering (single client, single worker thread), a worker thread processes the buffered intermediate graphics commands and submits graphics commands (GCMD) to the real graphics device GfxDevice.
These jobs have clearly defined inputs (RCMD) because they can run at the same time as user script code, which potentially changes the state of any object in the world. Jobs output commands (RCMD) to a different GfxDeviceClient per thread, and they write into their own block-allocating buffers, which the worker thread then executes.
Select image to expand
Type caption for image (optional)
Note: The worker thread does not wait until a job finishes before it starts executing its commands (IGCMD), but it always executes them in the same order they are scheduled.
Graphics Jobs (multiple clients, no worker thread)
Unity disables Graphics Jobs by default, but you can enable them in the Player Settings. Multiple native command generation threads take advantage of the graphics APIs that support recording graphics commands (GCMD) in a native format on multiple threads. This removes the performance impact of writing and reading commands in a custom format before submitting them to the API. Similar to the other modes, Graphics Jobs generate commands by calling GfxDevice functions. However, since the devices are now platform-specific, Graphics Jobs translate the commands directly into, for example DirectX 12 or Vulkan command buffers.
Select image to expand
Type caption for image (optional)
Note: Currently, Graphics Jobs do not have a renderthread to schedule jobs, causing a small amount of overhead on the main thread for scheduling.
Note: GPU profiling is automatically disabled when you enable Graphics Jobs.
Availability
Graphics Jobs are available depending on the graphics API and target platform. The following table gives an overview of the availability of Graphic Jobs on each platform and Graphics API.
Graphics API
iOS
Android
Desktop
OpenGLES 2/3
Not Supported
Not Supported
N/A
Metal
N/A
N/A
N/A
Vulkan
N/A
Configurable
Configurable
Profiling Rendering
When you investigate the rendering system while profiling, disable Multithreaded Rendering, Jobified Jobs, and Graphics Jobs to see the whole render queue executed on the main thread in singlethreaded rendering mode. This makes it easier to measure the timing and see the command queue easier.
Note: When you run in singlethreaded rendering mode to execute everything on the main thread, you get different timing, because the overhead of managing the other modes doesn’t appear in the profiler.
GfxThreadableDevice Functions
When you look at GfxDeviceClient functions in a native call stack while profiling, it often adds extra virtual functions from the GfxThreadableDevices class.
These extra functions are variations of the GfxDevice functions that take data that isn’t thread-safe (for example, ShaderLab::PropertySheet) and convert them to data that is thread-safe. When you call SetShaders() in Multithreaded Rendering, the main thread takes a ShaderLab::PropertySheet and turns it into plain serialized data that GfxDevice feeds to SetShadersThreadable() on the renderthread. When you investigate shader performance, measure the timing of the SetShadersThreadable() method to gain information on how long it takes to set actual shaders and compare them to their non-threaded equivalent.
The framebuffer contains the depth, stencil, and color buffers. Color buffers are an essential part and are always present, while other buffers can be present or not depending on the graphics features you use.
Double & Triple Buffering
If a device supports double or triple buffering, the graphics driver requires two or three framebuffers respectively.
With double buffering (and when VSync is enabled), your application must wait until the next vertical retrace before it starts rendering the next frame. Vertical retraces occur at the vertical refresh rate, typically in the 60–100 Hz range. If supported by the graphics driver, turning off VSync eliminates this delay and provides the highest frame rate. However, it can cause visual artifacts called tearing.
With triple buffering, your application renders a frame in one back buffer (a regular framebuffer). While it is waiting to flip, it starts rendering in the other back buffer. The result is that the frame rate is typically higher than double buffering (and VSync enabled) without any tearing.
Using more than one framebuffer comes with a graphics memory implication, especially on high-resolution displays when your application runs on Native Resolution.
Color Buffer
The number of framebuffers in used depends mostly on the graphics driver, and there is one color buffer per framebuffer. For example, when you use OpenGL ES on Android, Unity uses one EGLWindowSurface with a color buffer, but Unity doesn’t have control over how many color buffers and framebuffers it uses. Typically, Unity uses three framebuffers for triple buffering, but if a device does not support it, it falls back to double buffering and use two framebuffers including two color buffers.
Stencil & Depth Buffer
The stencil buffer and depth buffer are only bound to the framebuffer if graphics features use them. You should disable them if you know that your application does not require them, because a framebuffer occupies a great deal of graphics memory depending on resolution, and is resource-intensive to create.
To disable the depth buffer and stencil buffer, go to the Player Settings (menu: Edit > Project Settings > Player) window, scroll down to the Resolution and Presentation section and check the Disable Depth and Stencil* checkbox.
On mobile GPUs, the depth buffer and stencil buffer are two separate buffers with 24-bit for the depth buffer and 8bit for the stencil buffer. They are not combined in one buffer unlike on desktop platforms where the buffers are combined into one 32-bit buffer utilizing 24-bit for the depth buffer and 8-bit for the stencil buffer.
Native Resolution
Modern mobile phones have a very high resolution for their displays. The native resolution is often way over 1080p. Even for modern consoles, 1080p is difficult to support without a decrease in performance.
Tip: Control the resolution of your application and maybe even expose it so your user can reduce the resolution if they want to save battery life.
Use the Screen.SetResolution command to reduce default resolution and get performance back without losing quality.
Note: Setting the resolution to half of the native resolution might not always yield a positive effect on the visual fidelity.
Buffer Size
Calculate the framebuffer size and compare the results you get from a native profiler. For example, a full HD screen would have a resolution of 1920 x 1080, which is 2073600 pixels:
Once you multiply this by the number of bits you use for your color channels resolution, you get 66355200, which is the memory needed in bits.
Now divide it by 8, 1024, and 1024 to get it in Bytes, Kilobytes, and Megabytes.
The following table provides you with the memory by resolution and bit/channel.
Resolution
Pixel
Bits/Channel
Memory [Bits]
Memory [MB]
1920 x 1080
2073600
32
66355200
7.91
24
49766400
5.93
16
33177600
3.96
8
16588800
1.98
1440*2960
4262400
32
136396800
16.3
24
102297600
12.19
16
68198400
8.13
8
34099200
4.07
An application running on a Samsung Galaxy S8 with a resolution of 14402960 would use *97.68MB of graphics memory for the frame buffers when it operates in triple buffering using a 32-bit color buffer, 24-bit depth buffer, and an 8-bit stencil buffer. Those numbers help you compare memory stats while profiling memory with the native profiler on iOS (IOKit allocations in Instruments) and on Android (EGL mtrack allocations in dumpsys meminfo).
Final Blit
On Android and OpenGLES, Unity creates a framebuffer object with color buffer and depth buffer attachment, which Unity uses for all the rendering. At the end of the frame, Unity blits this framebuffer into the EGLSurface. From Unity 2017.2 you can change the Blit Type. Go to the Player Settings (menu: Edit > Project Settings > Player) window, scroll down to the Resolution and Presentation section and select the Blit Type in the drop-down menu.
When using Vulkan on Android, Unity does not perform the final blit, because doing so interacts with the existing BufferQueue component via the existing ANativeWindow interface, and uses Gralloc HAL for the data. For more details see the official Android documentation.
On mobile devices, it is essential to verify that all fragment shaders are mobile friendly. When you use built-in shaders, you should use the Mobile or Unlit version of the shader. Avoid excessive use of multi-pass shaders (for example, legacy specular) and excessive shader passes (that is, more than 2 passes).
Pass
High-End Mobile [ms]
Low-End Mobile [ms]
Empty
1.5
3
Multipass*
-
-
⋆ Time for multi-pass shaders (such as bloom) depends heavily on the screen resolution. Combining them into fewer passes leads to better performance.
Lightmaps
Where appropriate, you should use the most basic shaders. Make use of the inexpensive Mobile > Unlit (Supports Lightmap) shader to lightmap your Scenes.
Project Imports
You can remove every shader that you don’t use from the Always included list of shaders in the Graphics Settings (Edit > ProjectSettings > Graphics). Additionally, you can add shaders to the list which always includes them for the lifetime of the application. Tip: If you want finer control over load times, use shader variant collections instead; this lets you take the performance impact of loading at a time you choose during run time, rather than increasing your initial load time. See the section on Shader Preloading for more details.
Default Shaders
Some Unity Shaders are always included in the build by default, such as the Splash Screen, pink error Shader, and the clear screen. These Shaders account for a dozen kilobytes in total, but not in the range of megabytes. To see which shaders Unity includes in your build, read the build log.
Shader Build Report
After the build you can find data for large shaders in the Editor.log, which includes shader timing and size and looks similar to the following log:
 Compiled shader 'TEST Standard (Specular setup)' **in** 31.23s
     d3d9 (total **internal** programs: 482, unique: 474)
     d3d11 (total **internal** programs: 482, unique: 466)
     metal (total **internal** programs: 482, unique: 480)
     glcore (total **internal** programs: 482, unique: 454)
 Compressed shader 'TEST Standard (Specular setup)' on d3d9 from 1.04MB to 0.14MB
 Compressed shader 'TEST Standard (Specular setup)' on d3d11 from 1.39MB to 0.12MB
 Compressed shader 'TEST Standard (Specular setup)' on metal from 2.56MB to 0.20MB
 Compressed shader 'TEST Standard (Specular setup)' on glcore from 2.04MB to 0.15MB
This report tells you a couple of things about the Test shader:
The shader expands into 482 variants due to #pragma multi_compile and shader_feature.
Unity compresses the shader included in the game data to roughly the sum of the compressed sizes: 0.14+0.12+0.20+0.15 = 0.61MB
At run time, Unity keeps the compressed data in memory (0.61MB), while the data for your currently used graphics API (for example, Metal) is uncompressed, which in the above example would account for 2.56MB.
Shader Memory
Inspecting the log file shows the compressed disk size for single Shaders. To determine the size of Shaders at run time, you can perform a detailed memory capture with the Unity Profiler. If you complete a deep memory profile, you can inspect Shaderlab, which includes everything associated with Shaders under the Shaderlab root, including buffers, source code, and other allocations related to the compilation of shaders. Shaders themselves have their own object root, and the Profiler lists them under Shaders.
Shader Keywords
Shader keywords are global. Currently, you can only use 196 keywords, because Unity itself uses 60 internally.
When you build Shaders, you can use underscore _ for disabling/enabling purpose functionality to avoid occupying global keywords (for instance, when using #pragma multi_compile _SUPER_FEATURE).
Tip: use shader_feature over multi_compile as it saves memory by stripping unneeded keywords.
Shader Variants
Shaders often include a multitude of variants which increase build size and which might not be necessary.
If you use the following defines in a Shader, Unity generates variants with both A and C defined:
#if 1 #pragma multi_compile A B #else#pragma multi_compile C D #endif
Unity runs the code for parsing #pragmas for variants before the pre-process step. Avoid using #defines in shader code. To read more about shader variants, see documentation on Making multiple shader program variants.
Tip: Disable Shader settings (such as linear fog) in the Graphics Settings if you don’t need them. This removes variants to handle those settings from all Shaders when making a build.
Shader Variant Collections
Unity can preload shader variant collection during application load time, or you can load them via scripts. If you load them via script, you gain control over the loading process. See documentation on Optimizing Shader Load Time for more information.
Note: If you add a Shader and a variant collection which refers to it, Unity loads all sub-shaders (LODs) of the Shader when you warm up the variant collection.
Shader Preloading
Unity can preload Shaders and keep them in memory for the lifetime of the application, which grants control over how much memory Shaders occupy. Additionally, preloading Shaders reduces Scene load time issues as you control the time when Unity loads the Shaders.
Built-in shaders
Built-in Shaders on mobile are generalized for a specific use-case; for example, Unity made the UI/Default shader specifically for UI elements. You should remove any Shaders from the Always Included Shader list that you do not use.
Note: Unity can strip shaders from a build when you remove a Graphics API. Go to the Player Settings (menu: Edit > Project Settings > Player) window, scroll down to the Other Settings section and remove any Graphics API you don’t need. Unity still ships with the same binary as before, but does not use the Graphics API anymore. The benefit is that disabling an unused Graphics API strips all Shaders specific to it from the built-in Resources and saves disk space.